
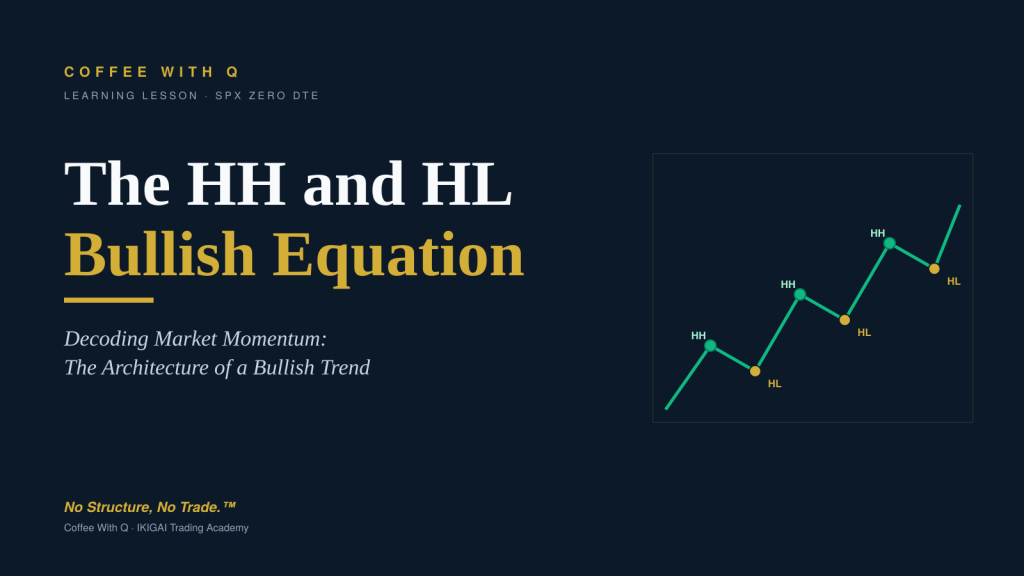
Coffee With Q Learning Lesson | SPX Zero DTE Edition By Q Zaman | IKIGAI Trading Academy
If you trade SPX Zero DTE, you live and die by the read of the trend.
One bad structure call and your premium goes to zero before the bell. So today we strip away every chart pattern, every indicator, every guru’s “secret signal,” and we look at the actual blueprint of what makes a market bullish.
No noise. Just geometry.
Decoding Market Momentum: The Architecture of a Bullish Trend
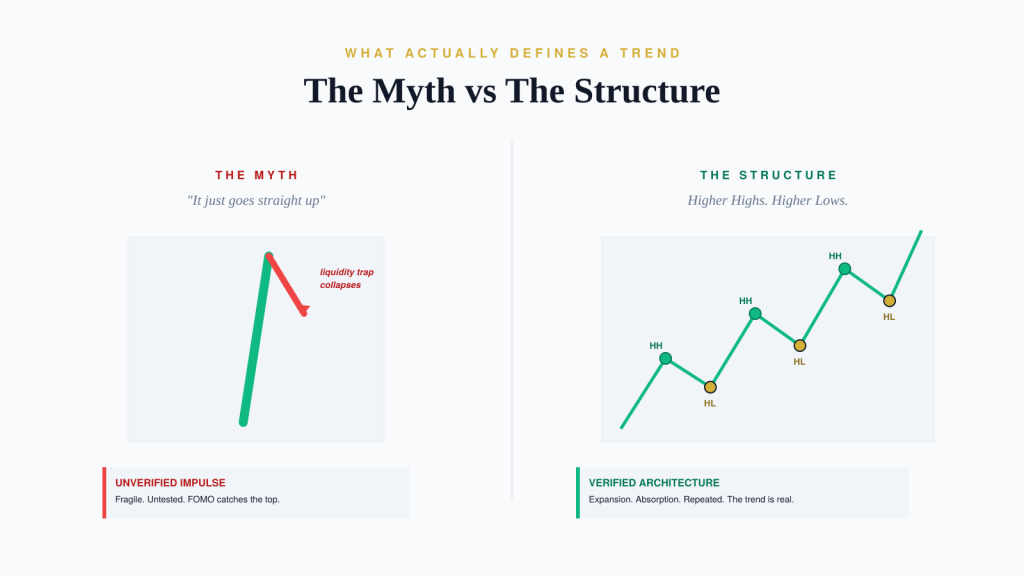
Imagine staring at a real-time price feed across your monitors. Suddenly, a massive, aggressive green candle rips vertically up the screen. The momentum is intoxicating. Financial news instantly starts buzzing, and the instinct of the broader market is that a bull run has definitively arrived. The fear of missing out (FOMO) kicks in immediately.
However, if a systematic, quantitative model looks at that exact same straight vertical line, it doesn’t see a confirmed trend at all. It sees an unverified impulse: a completely fragile, untested move that could easily be a liquidity trap about to collapse. If you follow Q ALGO Magnets and Q Levels you will not react but wait for what smart money is setting up as a trap.
In this deep dive into algorithmic market analysis, we move past emotional noise and momentum chasing to analyze the actual architectural blueprint of an upward trend. Filtering out the relentless noise of price action is the absolute hardest part of market analysis. As participants, we constantly battle our own psychology, trying to interpret every single tick on a chart. A systematic framework strips away that discretionary bias and removes emotion entirely.
The Foundation: Higher Highs and Higher Lows
The central thesis of a bullish market structure is that an uptrend is strictly defined by price making Higher Highs (HH) and Higher Lows (HL). It is a geometry-based formula. If that specific structural rhythm isn’t present, you don’t have a bullish market. You merely have localized volatility.
Identifying a true trend versus a false breakout is the ultimate edge in trading. The strength of a market isn’t proven by how fast it can jump into empty air. It is proven entirely by how it handles the inevitable exhaustion that follows.
The Initial Impulse and the Pullback
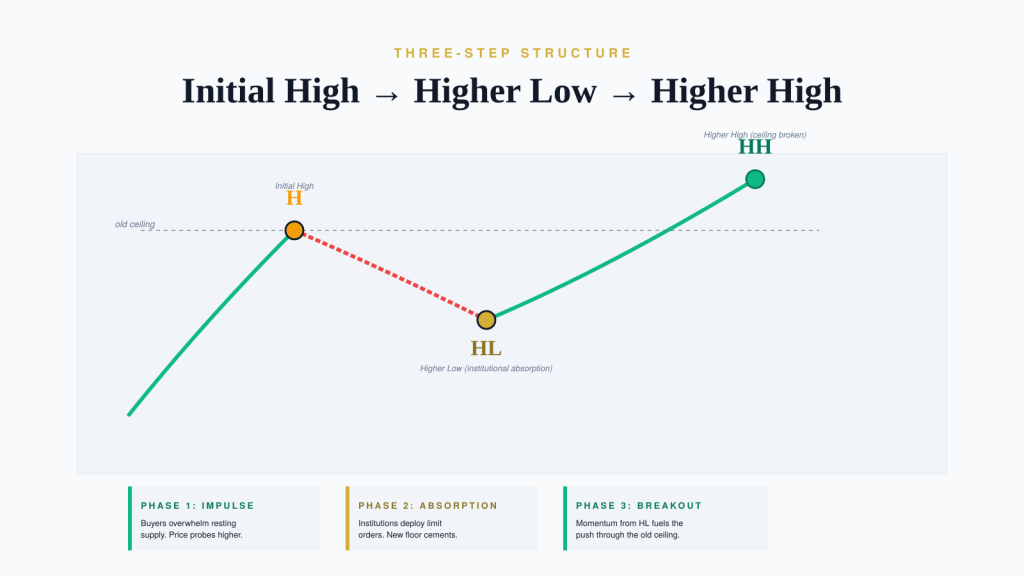
An uptrend begins with an initial vector: a distinct upward move peaking at an initial high (H). This represents the first aggressive shift in the order book, where buyers step in with enough volume to overwhelm resting sell orders. However, this initial burst is just price discovery. It’s a probe, not a trend. If you read this with QZ Decision Table and David’s Corner you will start to put together the story.
The actual integrity of the trend is validated by the sequence that follows. From that initial peak, the price must reverse and slope downwards. This deliberate drop from the peak into a new valley is the Higher Low (HL). The path to a bullish structure demands a retreat.
Understanding the order flow behind this retreat provides a massive analytical advantage. The initial buyers who rode the wave up naturally take profits, and short sellers might try to fade the move. This selling pressure forces the price down. The critical mechanic happens as the price drops: where do new buyers step in?
Institutional Absorption
As the price falls, institutional buyers who missed the initial surge or want to add to their positions begin deploying limit orders to absorb the selling pressure. If there is genuine, underlying bullish demand, these buyers will aggressively step in long before the price falls back to the starting point. They form a new elevated floor.
The moment the selling is fully absorbed and the price stabilizes, that valley is cemented as the higher low. This proves that demand is stronger than supply and that market participants are willing to pay a premium compared to the original starting price. They aren’t waiting for a full discount. They step in early because they fundamentally believe the asset is heading higher. Read
Breaking the Ceiling: The Higher High
Establishing a new floor is only half the architecture. To keep the bullish sequence alive, the market must actively break the previous ceiling. From the established HL valley, the price must surge upward once more, bursting through the old peak to form a brand new peak: the Higher High (HH).
Breaking that ceiling isn’t a passive event. It takes effort. Think of the physical mechanics of climbing a staircase. To move to a higher floor, you must firmly plant your foot on the step beneath you (the higher low) to generate the mechanical leverage required to push up to a new elevation (the higher high).
When the price originally peaked, it created a zone of resistance with resting liquidity. Limit sell orders from traders wanting to short the top, or trapped buyers wanting to break even. To push through that old ceiling, the market requires an immense amount of buying volume to chew through all that supply. It gathers this fuel by building momentum off the institutional accumulation at the higher low.
When the price finally rips through the old high and establishes the higher high, it is the ultimate proof of structural dominance. It shows that buyers are actively willing to pay higher premium prices, completely overwhelming any available supply.
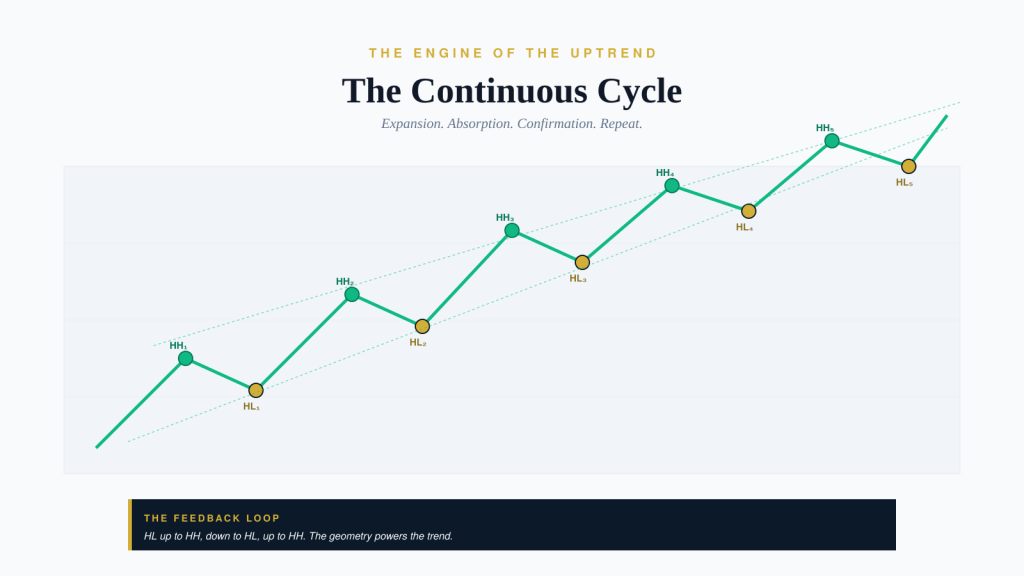
The Continuous Cycle
A true trend is a breathing, moving progression. It establishes a distinct visual rhythm: zigzagging upward. It pushes the boundaries of price, retreats to test the structural integrity, confirms the new support level holds, and then utilizes that newly confirmed support to launch the next expansion phase.
This continuous feedback loop, HL up to HH, down to HL, up to HH, is the literal engine powering the uptrend.
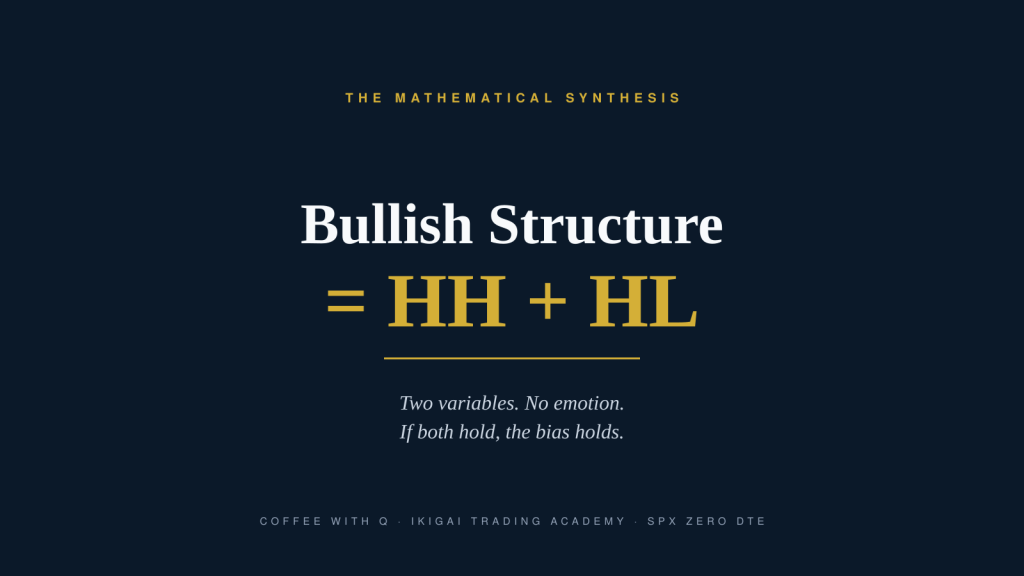
The Mathematical Synthesis
At its core, this chaotic marketplace can be distilled into a stark mathematical synthesis:
Bullish Structure = HH + HL
This two-variable equation is why algorithmic trading models are so ruthlessly effective. The market is designed to elicit emotional responses. When a retail trader sees a sharp pullback, their immediate response is fear, and they panic sell. A systematic model does not experience fear. It simply measures the depth of the pullback against the previous low. If the new low remains mathematically higher than the old low, the HL variable remains true.
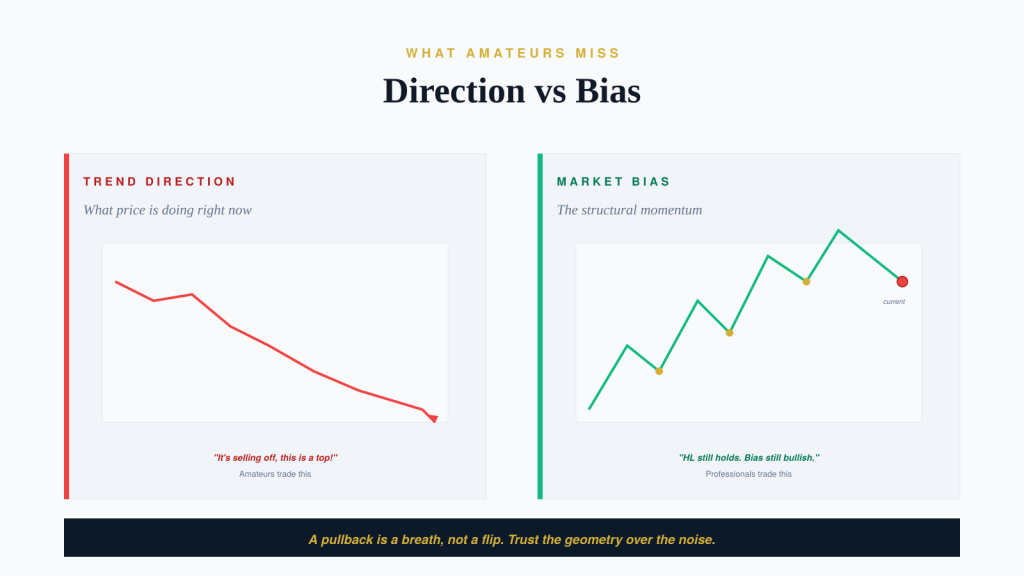
Trend Direction vs. Market Bias
It is crucial to distinguish between trend direction and market bias:
- Trend Direction: What the price is actively doing in the immediate short term.
- Market Bias: The underlying structural momentum.
You could be in the middle of a sharp pullback where the immediate trend direction is temporarily pointing down as the market seeks liquidity. But as long as the equation (Bullish Structure = HH + HL) hasn’t been violated, the overarching market bias remains undeniably bullish.
Amateurs trade the immediate direction. Professionals trade the structural bias.
Conclusion
A true bullish environment is never defined by prices that only move up. A straight vertical line is a myth that traps inexperienced capital. True structural strength is defined by the rhythm of expansion and absorption.
As long as the geometric stepping sequence remains intact, the structural guarantee of the market is in your favor. Trust the geometry over the noise.
However, as a structural analyst, you must always ask the critical question: what happens in the exact microsecond a pullback fails to find institutional absorption? What happens when a drop doesn’t stay above the previous low, and the fundamental equation finally breaks?
That is where the real structural shift begins.

Trade With Us
This lesson is part of the Coffee With Q Learning Series, built for traders who want to read SPX Zero DTE structure the way the algorithms do. If this resonates with how you want to trade, the IKIGAI Trading Academy doors are open.
Coffee With Q | IKIGAI Trading Academy Read the candle. Confirm the structure. Then take the shot.
Disclaimer
Trading futures and options involves substantial risk and is not suitable for every investor. All material provided through Ikigai, CoffeeWithQ, Q Levels, or related educational programs is strictly for educational purposes only and should not be considered financial, investment, or trading advice. Past performance does not guarantee future results. You are solely responsible for your trading decisions and any associated gains or losses.