

IKIGAI Trading Academy / Market Structure
Most traders stare at price and wait for something obvious to happen.
We are going to walk through it phase by phase so you never miss it again.
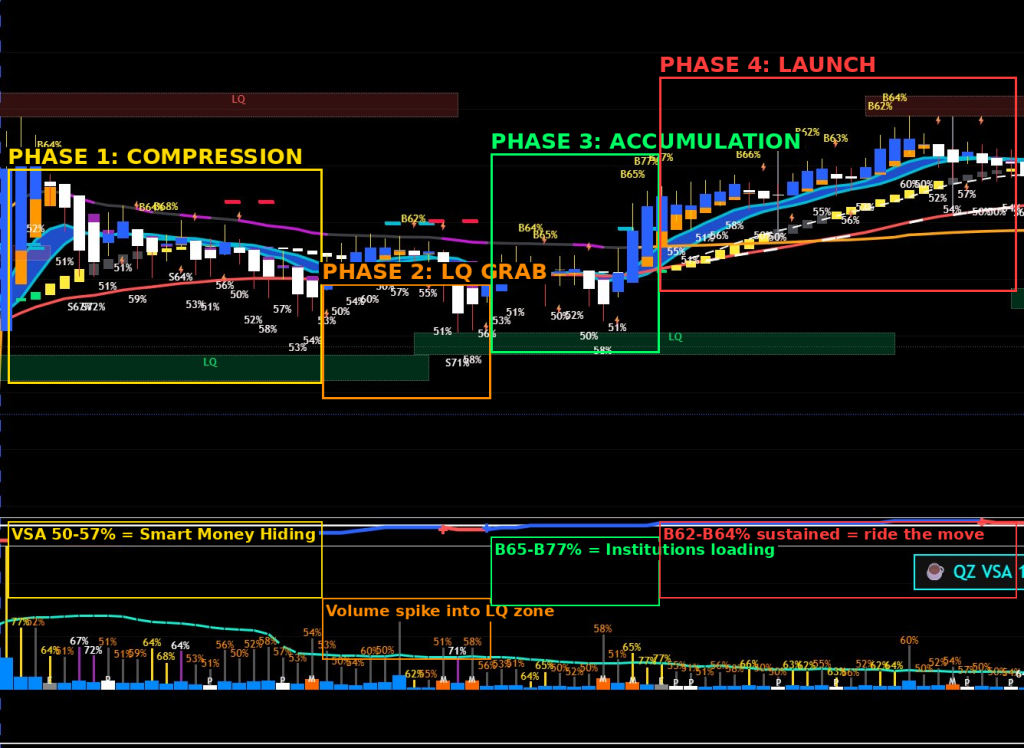
SPY / QZ VSA 10.0 SM | 4 Phases of Accumulation Marked | IKIGAI Trading Academy
Phase 1
Compression
Look at the left side of the chart. The price is going nowhere. Candles are mixed, range is tight, and the VSA is printing 50% to 57% buy. That looks like nothing. It is not nothing.
That is smart money not showing their hand. They are building a position slowly, keeping the market flat so retail traders get bored and leave or retail traders want to take a trade.
When you see that 50% to 57% VSA range holding for multiple bars with price not breaking down, pay attention. The base is being built.
Phase 2
The Liquidity Grab
See those green LQ boxes below price? That is where the stops are sitting. Every retail trader who went long placed their stop just below support. Market Makers know exactly where those stops live. Price dips into that LQ zone, triggers the stops, and absorbs all those sell orders at a discount. Watch the VSA during this dip. No panic volume. No flush. That tells you institutions are buying into that weakness, not running from it. If volume spiked hard during the dip, that would be distribution. Controlled volume on a dip into LQ is accumulation.
Phase 3
Accumulation Confirmed
After the LQ grab, the VSA shifts. You start seeing B65%, B77%, B77% back to back. Volume expands. The candles turn blue and strong. This is the confirmation. The smart money absorbed all the sell pressure they needed, and now they are letting price run. This is your entry window. Not when the big candle starts. When the VSA flips strong off the LQ zone. That is the signal.
Phase 4
The Launch
Price breaks out clean. You see B62% to B64% sustained across multiple candles as price moves from 680.50 toward 682.00. The upper LQ zone at 682.00 becomes the next target. The move is not a mystery at this point. It was set up over every phase that came before it. If you were watching VSA through Phase 1, you were ready. If you were waiting for the big candle, you were late.
The Rule
The 50% VSA reading is not the absence of a signal. It is the signal. Compression plus LQ below price plus controlled volume equals a setup building. You do not chase it. You read it, you wait for the LQ grab, you watch for VSA confirmation, and then you act. I am not saying here to enter on 50% and hold of 30 minutes as we are trading 15 seconds and we are scalping. You need to build an edge as I explained in Sunday webinar.
This is what the ALGO is showing you every day. The information is there. The sequence is the same. What changes is your ability to recognize it before it is obvious.
That is what we are training. Not just what the indicators mean. How to read them together in sequence so you see the move before it starts.
What I showed you on Sunday is what I have explained above. Now take out a paper, evaluate 300 candles and see price (result) and flow effort. The picture is clear.
I’m teaching you to think.
DISCLAIMER
This is not investment advisory. I’m not calling trades. I’m teaching you to think. Trading futures and options involves substantial risk of loss and is not suitable for all investors. Past performance is not indicative of future results. The IKIGAI Algo and any associated indicators, tools, or educational materials are provided for informational and educational purposes only and do not constitute financial, investment, or trading advice. You should consult with a qualified financial advisor before making any trading decisions. Q Levels and affiliated parties are not registered investment advisors, broker-dealers, or financial planners. By participation, you acknowledge you are solely responsible for your own trading decisions and any resulting gains or losses. No guarantees of profit or specific results are made or implied. All sales are final. Please trade responsibly and only risk capital you can afford to lose.