
By Qamar Zaman | Coffee With Q | IKIGAI Trading Academy
Most traders look at candlesticks like they’re reading tea leaves.
“Oh look, a shooting star! Time to short!”
Then they get run over.
Here’s the truth nobody tells you: A candlestick is not a signal. It’s a crime scene. And if you can’t read the evidence, you’re going to be the victim—not the detective.
In this breakdown, I’m going to show you exactly how I read bearish rejection candles on the 5-minute chart for SPY 0DTE scalps. Not theory. Not textbook patterns. The actual battle between bulls and bears—and how to know who’s winning before you risk a single dollar.
This is the stuff we teach inside IKIGAI Trading Academy. Consider this your free taste.
Stop Trading Shapes. Start Reading Stories.
Every candle tells a story. A bearish rejection candle—what the textbooks call a “shooting star“—tells one of the most profitable stories in trading:
Bulls pushed hard. Smart money said “no.” Bears took control.
But here’s where 90% of traders get it wrong: they trade the shape without reading the story.
A shooting star at the wrong location? That’s not a short setup. That’s a trap waiting to happen.
A shooting star at a key institutional pivot level with volume spiking? Now you’ve got something.
Let me show you what I mean.
The Anatomy: What You’re Actually Looking At
A bearish rejection candle has three non-negotiable features:
| Feature | What It Tells You |
| Long upper wick | Price tested higher, got smacked down. Buyers trapped at the top. |
| Small body near the bottom | Sellers maintained control into the close. No recovery. |
| Close below open (red body) | Bears won this round. Period. |
The benchmark: Upper wick should be roughly 3-4x the size of the body. That’s what “significant rejection” looks like on the tape.
But here’s where it gets interesting for 0DTE players…
The 5-Step Battle: What Actually Happened Inside That Candle
Think of every 1-minute candle as a 60-second war. Here’s how the bearish rejection battle unfolds:
Step 1: Price Opens — The Bell Rings
The candle opens near what becomes the bottom of the body. Neither side has won yet. This is the starting line.
Step 2: Bulls Attack — The Fake Breakout
Buyers push price UP aggressively. On your screen, this looks bullish as hell:
- Green momentum
- Breaking above a level
- Shorts covering
- Retail FOMO kicking in
This is the upper wick being built. During this phase, it looks like the move is ON.
This is where amateurs buy.
Step 3: Smart Money Steps In — The Absorption
At or near the high, something shifts. Sellers start absorbing every buy order that comes in.
This is where:
- Institutions distribute into retail strength
- Resting sell orders at key levels get filled
- The market says “NO” to those highs
You can’t always see this on the candle alone. But you can see it in context—which I’ll show you.
Step 4: Price Collapses — The Rejection
Once the buy orders dry up, sellers slam price back down. Fast.
All those gains? Gone.
On the candle, the long upper wick is now visible. The body migrates to the bottom. Breakout buyers are now trapped at the top with underwater positions.
This is where professionals short.
Step 5: Close Below Open — Bears Win
By the close:
- Price is below the open
- Body is small, sitting near the low
- The message is clear: sellers won this candle
That’s the bearish story encoded in one 60-second battle.
The Evidence Checklist: How I Read It In Real-Time
When I’m scanning for 0DTE scalp entries, I need fast, objective confirmation. For bearish rejection candles, I look for three pieces of evidence:
| Evidence | Translation |
| Long upper wick | Higher prices rejected. Late buyers trapped. |
| Small body at bottom | Bears held control into close. No recovery attempt succeeded. |
| Wick-to-body ratio 3-4x | This is real rejection, not random noise. |
But here’s the thing—evidence without context is worthless.
Context Is Everything: When This Candle Actually Matters for 0DTE
The same bearish rejection candle can be:
- A high-probability short setup worth 50%+ on your 0DTE puts
- Complete noise that chops you up
The difference? Where and when it forms.
Location, Location, Location
Bearish rejection candles matter most when they form at:
- Q Levels
- Prior swing highs
- Overnight highs / Previous day high
- VWAP upper bands
- The “Magnet” zones we identify in IKIGAI Wings
These are where liquidity pools live. Where stops and breakout orders stack up. When a rejection candle forms HERE, it often means institutions just used that liquidity to distribute.
Time of Day
Not all 1-minute candles are created equal:
- 9:30-9:45 AM: Opening range volatility. Be careful—these can be head fakes.
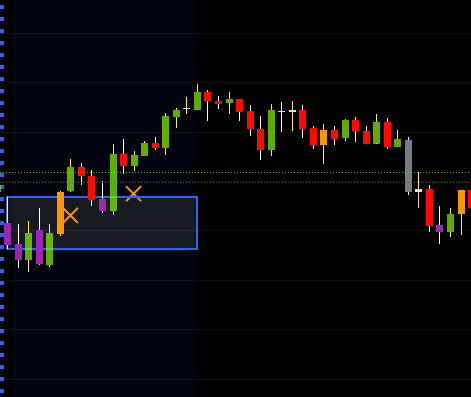
- 9:45-11:00 AM: Prime time for real moves. This is where my MAGIC BOX setup lives.
- 11:00 AM-2:00 PM: Lunch chop. Rejection candles here often fail.
- 2:00-4:00 PM: Power hour. Real institutional moves.
Caution: 📰 News Catalyst – 10:00 AM EST
Avoid holding or entering trades around this time. Scheduled news releases and high-impact events (e.g., FOMC, Fed speakers, data drops) often trigger impulsive, whipsaw price action that invalidates clean setups.
Trader Rules Style
Rule: Flat into 10:00 AM news. Trade resumes only after volatility settles and structure re-forms.
A bearish rejection at 10:15 AM at Q LEVELS resistance level? That’s A-grade.
The same candle at 12:30 PM in the middle of nowhere? That’s noise.
Volume Confirmation
High relative volume during the wick + failure to hold = real rejection.
No volume = random spike on a thin tape. Skip it.
The Q Algo 6-Point Checklist: See the Full Picture
Here’s where we separate the pattern-traders from the professionals.
A bearish rejection candle is ONE piece of evidence. But I never trade on one piece of evidence. That’s gambling.
Inside IKIGAI Trading Academy, we use the Q Algo 6-Point Checklist to stack confluence before we risk capital. Here’s how a shooting star fits into the framework:
✅ Point 1: Trend Bias
Question: What’s the dominant trend on the higher timeframe?
A bearish rejection against a strong multi-day uptrend is very different from one appearing at an exhausted, overextended high.
For 0DTE: I check the 5-min and 15-min trend before trading a 1-min signal. If higher timeframes are bearish or neutral, my rejection candle carries more weight.
✅ Point 2: Location & Levels
Question: Is the candle forming at a premium zone?
- Prior swing high
- (Q Levels)
- VWAP +1 or +2 deviation
- Key weekly/monthly levels
- Overnight high
If you’re shorting the middle of nowhere, you’re the liquidity—not the one taking it.
✅ Point 3: Liquidity & Order Flow Context
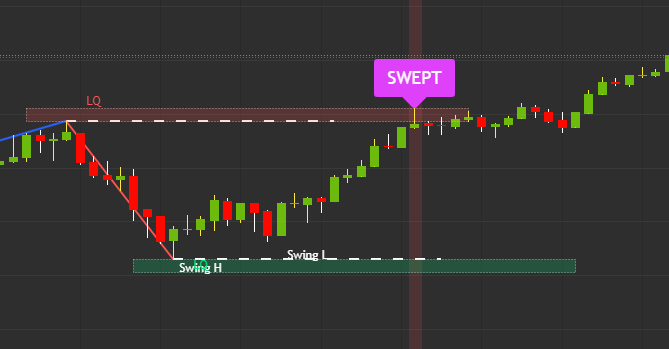
Question: Were stops and breakout orders triggered above a prior high and immediately rejected?
This is where the long upper wick aligns with trapped buyers and institutional distribution.
For 0DTE: I watch for a sweep of a prior high followed by immediate reversal. That’s the “trap and snap” setup.
✅ Point 4: Volatility & Session Context
Questions:
- What time of day?
- Did news or data just drop?
- Is IV elevated or crushed?
For 0DTE: Session context is CRITICAL. A rejection candle during the 9:45-11:00 window with elevated IV? Prime setup. Same candle during lunch chop? Skip.
✅ Point 5: Signal Quality & Confirmation
Questions:
- Does the candle meet objective criteria? (wick-to-body ratio, close position, volume)
- Does the next candle confirm the shift?
For 0DTE: I want to see the following candle break the low of the rejection candle. That’s my confirmation that sellers are truly in control.
✅ Point 6: Risk & Trade Management
Questions:
- What’s my exact entry, stop, and target?
- Does this offer risk/reward potential?
- How do I manage if it stalls?
For 0DTE:
- Entry: Break of rejection candle low, or aggressive entry near the close
- Stop: Above the wick high (that’s where the idea is invalidated)
- Target: Next Q Level down, prior swing low, or VWAP
Never oversize because the pattern “looks perfect.” The market humbles everyone eventually.
Putting It Into Action: The 0DTE Scalp Setup
Check IKIGAI Master Academy https://www.coffeewithq.org/gp/
The Bottom Line
A bearish rejection candle is not just a pattern to memorize. It’s a compressed 60-second story:
- Bulls drove price to new highs
- Smart money used that strength to sell
- Bears absorbed the flow and forced a reversal
- Late buyers are now trapped at the top
Read correctly, this candle shows you where the market said “NO”—and where traders are caught on the wrong side.
But one candle is never enough.
Professional trading is about stacking context—trend, levels, liquidity, session, confirmation, and risk—until the picture is undeniable.
Use the candlestick anatomy to understand the battle.
Use the Q Algo 6-Point Checklist to see the full battlefield before you attack.
That’s how you turn a simple shape on the chart into a repeatable, disciplined edge for 0DTE scalps.
Ready to Go Deeper?
This is just the surface. Inside IKIGAI Trading Academy, we go much deeper:
- Daily Q Levels
- The MAGIC BOX 7 setup for opening range manipulation
- QZ Magnets for intraday roadmaps
- Live trade breakdowns and cohort coaching
If you’re serious about mastering 0DTE options with a structured, professional approach—not gambling on patterns—we should talk.
Coffee With Q | IKIGAI Trading Academy
Trade with intention. Trade with an edge. Trade with IKIGAI.
Disclaimer: Trading options, especially 0DTE options, involves substantial risk of loss and is not suitable for all investors. Past performance is not indicative of future results. This content is for educational purposes only and should not be considered financial advice. Always do your own due diligence and consult with a qualified financial advisor before making any investment decisions. Errors and omissions excepted (E&OE). While every effort has been made to ensure accuracy, the author is not responsible for any errors or omissions in this content.
© 2025 Qamar Zaman | Coffee With Q | IKIGAI Trading Academy | All Rights Reserved