

A simple guide to reading BLUE, GREEN and RED without treating the colors as trade signals
Have you ever entered a trade with the correct directional idea, only to watch price stall while your option barely moved?
The problem may not have been your direction. You may have entered the wrong market environment.
The QZ Market Temperature framework is designed to answer a practical question:
When price reaches a particular area, is the options environment more likely to absorb the move or amplify it?
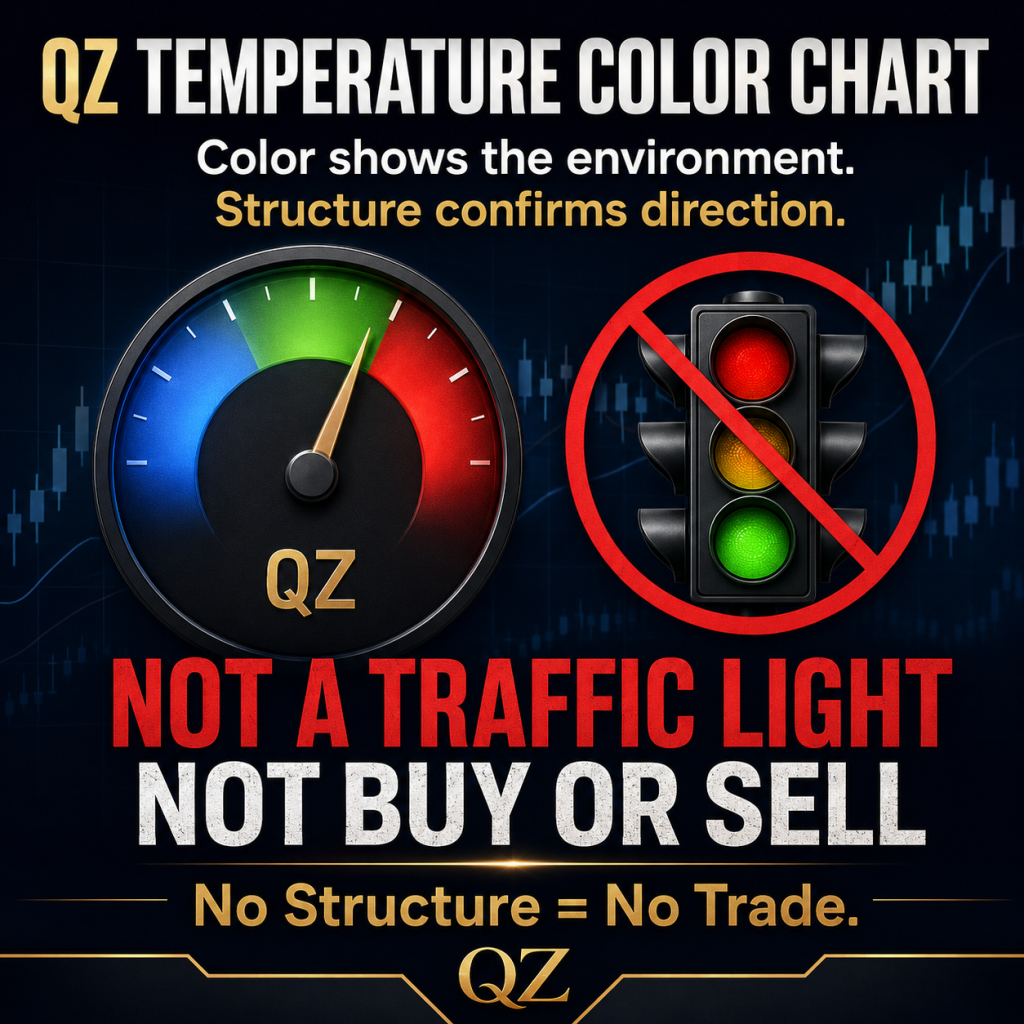
The colors help us anticipate the character of price movement. They do not predict direction, and they are not a traffic light telling us when to buy or sell.
Color shows the environment. Structure confirms direction.
What the temperature map measures
Options dealers and market makers often hedge the risk created by the options positions on their books. As the underlying price changes, their hedging needs can change too.
Depending on their estimated net exposure, that hedging may have one of two broad effects:
- It may lean against price movement, helping produce stalls, rotations and ranges.
- It may move with price, adding fuel to an already developing move.
The QZ Market Temperature map converts that complex options positioning into three easy-to-read conditions: BLUE, GREEN and RED.
These colors are not universal Wall Street definitions. They are labels used within this framework to simplify a probability model.
BLUE: The overall environment is positive
A BLUE day means the estimated total net exposure for the selected expiration is positive.
In simple terms, market-maker hedging is more likely to act like a brake:
- When price rises, hedging may involve selling.
- When price falls, hedging may involve buying.
That activity can push against both sides of the move. As a result, price may rotate, stall or return toward a nearby level instead of traveling smoothly in one direction.
For a trader, the practical lesson is simple: do not overstay a scalp just because the initial direction was correct.
On a BLUE day, a clean move can still occur. However, unless structure is strong enough to overpower the stabilizing pressure, follow-through may be smaller and slower than expected.
GREEN: A positive strike or stabilization pocket
GREEN identifies a strike or price area where the estimated exposure is positive, even if the broader day is BLUE or RED.
Think of a GREEN level as a local stabilization pocket. When price enters that area, hedging may help:
- slow a rally;
- cushion a decline;
- hold price near the strike;
- create repeated rotations or chop.
This is why price can appear to become “stuck” near a GREEN level.
GREEN does not automatically mean support, and it does not mean “buy calls.” If market structure is bearish, price can still break through the area. GREEN only warns that the path may become slower, less efficient and more rotational.
RED: The overall environment is negative
A RED day means the estimated total net exposure for the selected expiration is negative.
In this environment, hedging can become more reactive and may move in the same direction as price:
- When price rises, hedging may require additional buying.
- When price falls, hedging may require additional selling.
Instead of acting like a brake, this behavior can act like an accelerator. Once market structure breaks, moves may expand quickly.
RED conditions can produce:
- larger candles;
- faster extensions;
- sharper reversals;
- bursts of movement followed by temporary ranges;
- greater risk of slippage and chasing.
RED does not mean the market must fall. Negative exposure may amplify movement in either direction. Structure still determines whether the active opportunity is bullish or bearish.
It is also important not to describe RED as an automatic “great place to make money.” Faster movement creates opportunity, but it also creates greater execution risk. An accelerator works in both directions, including against the trader.
The easy rule
| Temperature | Likely hedging behavior | Common price character | Trader mindset |
| 🔵 BLUE | Leans against movement | Range, rotation, smaller follow-through | Take profits efficiently and avoid overstaying |
| 🟢 GREEN | Stabilizes near a local strike or pocket | Stall, chop, pinning or absorption | Expect friction and wait for structure |
| 🔴 RED | May move with price | Expansion, acceleration and sharper swings | Respect momentum, but do not chase |
Why price can remain stuck at one level
Suppose SPY trades near 740 and repeatedly moves above and below it without producing a clean extension.
If 740 is inside a positive-exposure area, hedging may repeatedly lean against the move. Selling into strength can slow the rally, while buying into weakness can cushion the decline. Price becomes trapped between nearby market-structure points.
To the trader, the chart looks indecisive. The option premium may also respond poorly because the underlying is not traveling far enough or fast enough.
The lesson is not to guess when the “gate” will open. The lesson is to wait for evidence:
- a clear break of the range;
- a close beyond the relevant structure;
- a successful reclaim or rejection;
- a new Higher High and Higher Low for bullish structure;
- a new Lower Low and Lower High for bearish structure.
Until that evidence appears, the chop is information.
Temperature and structure must be used together
Temperature describes the likely speed and behavior of a move. Market structure determines its direction and validity.
That distinction prevents several common mistakes:
- BLUE does not mean bearish.
- GREEN does not mean bullish.
- RED does not mean “buy puts.”
- A level is not an entry by itself.
A practical decision process is:
- Identify the trend.
- Read market structure.
- Locate price within the temperature map.
- Evaluate flow and velocity.
- Enter only when the evidence aligns.
- Manage the trade according to the environment.
This is the core rule:
Trend → Structure → Level → Flow → Velocity
If price is inside a BLUE or GREEN range with no clean structure, the best trade may be no trade. If price breaks structure inside a RED environment, expansion may become more likely, but the entry must still be disciplined.
A GPS, not an autonomous vehicle
The temperature map is best understood as a GPS.
It can show where traffic may slow, where the road may open and where conditions may become dangerous. It cannot drive the car for you.
The trader must still:
- read the chart;
- recognize congestion;
- identify previous highs and lows;
- wait for confirmation;
- control risk;
- exit when the original structure fails.
No options-positioning model is 100% accurate. Exposure estimates depend on available data and modeling assumptions, while price can also be affected by news, economic releases, institutional order flow, volatility and changes in supply and demand.
The map gives us probabilities, not promises.
Final takeaway
Use the colors to understand the environment, not to predict the trade.
- BLUE warns that hedging may absorb movement and encourage range.
- GREEN marks a local area where price may stabilize, stall or rotate.
- RED warns that hedging may amplify movement once structure begins to run.
Then let market structure make the final decision.
Color shows the environment. Structure confirms direction.
Not a traffic light. Not a buy or sell signal.
No Structure = No Trade.
Risk Disclosure
This material is provided for educational and informational purposes only. It is not financial, investment, trading or legal advice, and it does not constitute a recommendation to buy or sell any security or financial instrument. Options trading involves substantial risk of loss and is not suitable for all investors. Market-maker positioning and exposure levels are estimates based on available data and modeling assumptions; they may change and may not accurately predict future price behavior. Past performance is not indicative of future results. Always conduct your own due diligence and consult a qualified financial professional when appropriate.