
Read on the 15-min SPY chart — March 16, 2026
SCENE 1 — THE NIGHT BEFORE
INT. MARKET — OVERNIGHT
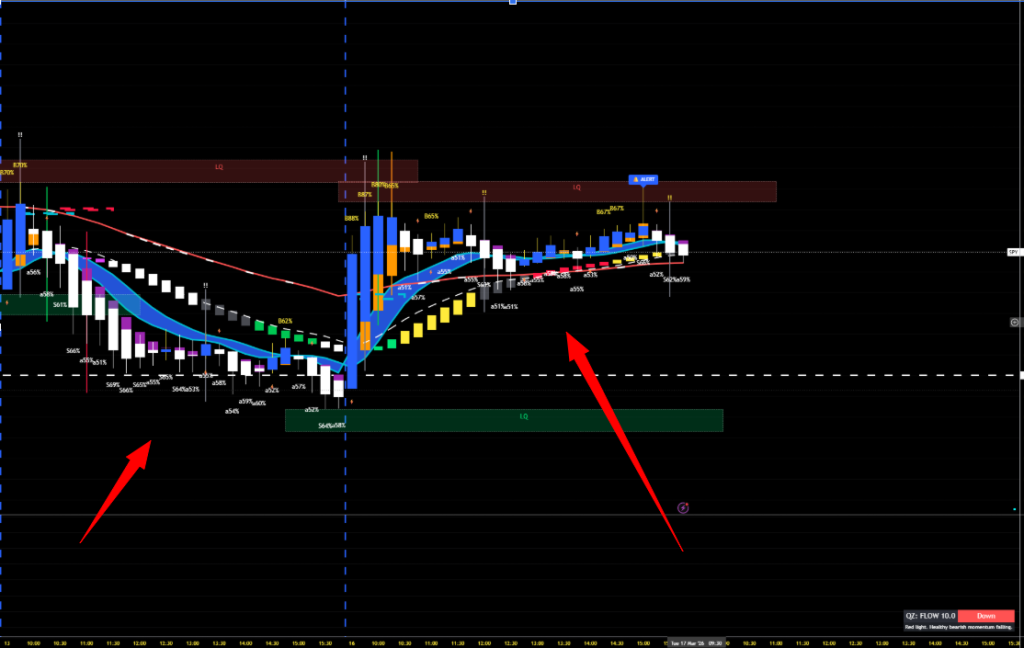
Nobody is watching. Volume is thin. The screen shows a52%… a57%… a59%… a60% in quiet white text. No fireworks. No headlines.
This is the real estate mogul buying every lot on the block through shell companies. No-one sees it because it looks like nothing. Just a small lowercase a sitting quietly below the candle.
S64%… S58% appear. Retail is panic-selling into a green LQ zone. The Market Maker absorbs every single share. No resistance. No urgency. Just accumulation.
The algo reads:
a% in green LQ zone = the mogul is loading
Nobody else sees it. That is the point.
SCENE 2 — THE SPIKE
INT. MARKET — 09:45 AM
The blue flip line fires. The blue dashed vertical cuts through the chart like a starting gun. Three candles follow:
B87% — The fuse is lit. Price rockets violently upward. Retail sees a huge green candle and panics in. This is not buying. This is bait.
B80% — The handoff. Both sides active simultaneously. The Market Maker is selling their overnight position INTO the retail buy orders flooding the tape. Price still looks bullish. Retail has no idea.
B65% — The door closes. Retail is fully in. SMC is fully out. Watch that number fall — from 88 to 80 to 65 — while price is still going up. That is the divergence. Price rising. Dominance falling. Someone is selling into the move. That someone is not retail. Retail was buying.
Then the algo says one word:
!! — SIREN. The alarm fires exactly once. The market just told you it is too late.
SCENE 3 — THE TRAP
INT. MARKET — 10:00 AM
After the !! fires, the grey bricks arrive. S63% appears. Then S79%… S80%. The Market Maker is now short. Retail is holding long positions at the top of the move, watching their profits evaporate, wondering what happened.
Then — quietly — a51%… a51% returns. The mogul is reloading. Not longs this time. Shorts. The same quiet accumulation. The same lowercase whisper. The same thing retail missed the first time.
The cycle is complete.
THE MAVERICK READS IT LIKE THIS
a% in green LQ zone = The mogul is loading. Watch. Do not chase.
Flip line fires = Safety off. Get ready.
a% still showing on first bricks = Not explosive yet. This is the entry.
B65%+ fires = Move is underway. Trail your stop. Do NOT enter here.
B88% candle = MM exit. Retail entry. You are the bag.
!! fires = Finger off trigger. One warning. That is all you get.
S% near red LQ zone = Exit or flip. The mogul is selling to you again.
THE ONE NUMBER THAT TELLS THE WHOLE STORY
Buyer dominance dropped from 88% → 80% → 65% on three consecutive candles while price was still going up.
Price rising. Dominance falling. That is the divergence signal. That is the fingerprint of the Market Maker unloading.
This is why a / B / S together tells a story no single indicator can tell alone.
Fly smart. Fly Maverick.
© IKIGAI Trading Academy
This is not investment advisory. I’m not calling trades. I’m teaching you to think.
Trading futures and options involves substantial risk of loss and is not suitable for all investors. Past performance is not indicative of future results. The IKIGAI Algo and any associated indicators, tools, or educational materials are provided for informational and educational purposes only and do not constitute financial, investment, or trading advice. You should consult with a qualified financial advisor before making any trading decisions. Q Levels and affiliated parties are not registered investment advisors, broker-dealers, or financial planners. By participating in this program, you acknowledge that you are solely responsible for your own trading decisions and any resulting gains or losses. No guarantees of profit or specific results are made or implied. All sales are final. Please trade responsibly and only risk capital you can afford to lose.