
By Qamar Zaman | Coffee With Q
What If You Could See the Invisible Hand?
Every day, millions of traders stare at charts looking for the next move. They draw trendlines. They watch for breakouts. They chase momentum.
And every day, most of them lose.
Why? Because they’re watching the wrong thing.
While retail traders focus on price, the real game is happening behind the scenes. Market makers—the dealers who take the other side of your options trades—are constantly adjusting their positions. And those adjustments don’t just happen quietly. They move price.
I call this force Dealer Throttle.
The Mechanics (Without the Math)
Think about what happens when you buy an option.
Someone has to sell it to you. That someone is typically a market maker—a dealer. The moment they sell you that call option, they’re exposed. If the stock rips higher, they lose money.
So what do they do? They hedge.
If they sold you calls, they buy stock to protect themselves. If they sold you puts, they sell stock. This isn’t speculation—it’s survival. And when thousands of contracts are sitting at specific strikes, the hedging activity at those levels becomes massive.
Here’s where it gets interesting: this hedging activity changes throughout the day.
As time passes, options decay. That decay doesn’t happen evenly—it accelerates. And as it accelerates, the dealers’ hedging requirements shift. They’re constantly adjusting, buying and selling stock to stay balanced.
This creates directional pressure that most traders never see.
Dealer Throttle visualizes that data.
The Throttle Effect
Imagine price as a car on a highway. Most traders think the car drives itself—that price moves based on supply and demand, news, and sentiment.
But there’s someone else in the driver’s seat.
The dealers have their foot on the throttle. When call positions dominate at nearby strikes, they’re pressing the gas—buying stock, pushing price higher. When put positions dominate, they’re hitting the brakes—selling stock, pulling price down.
The closer we get to expiration, the harder they press.
This is why:
- Price often gravitates toward high open interest strikes
- Moves accelerate into the close on expiration days
- “Random” reversals happen at seemingly arbitrary levels
- Certain price zones feel “sticky” while others slice through cleanly
It’s not random. It’s data. It’s Dealer Throttle.
Reading the Data
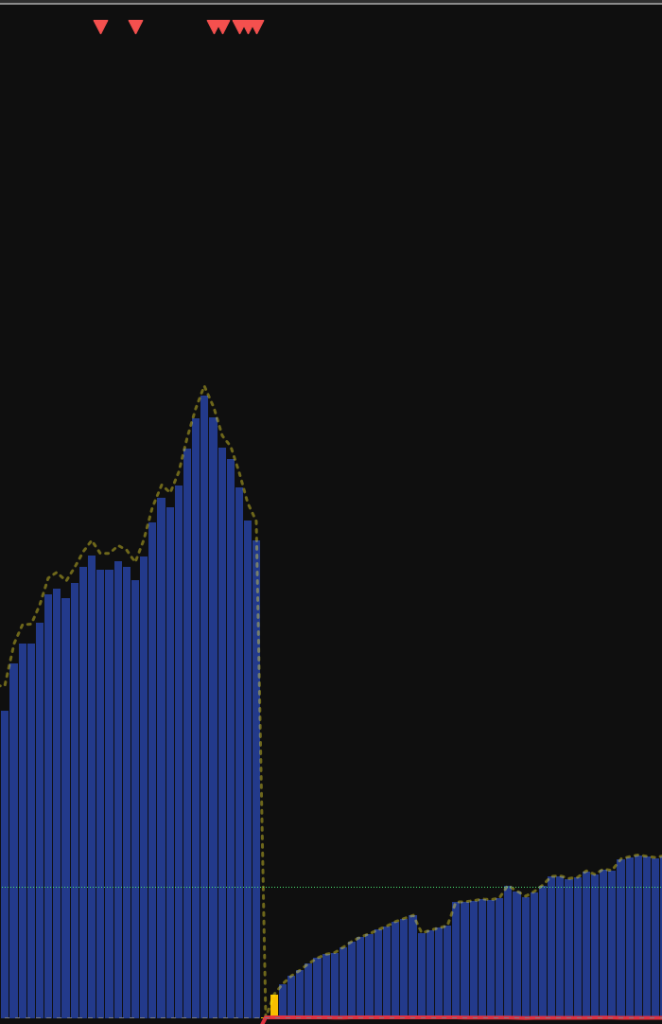
Without revealing the proprietary mechanics, here’s what Dealer Throttle displays:
Positive Throttle (Green): Data shows dealers are being forced to buy. Call delta is gaining sensitivity. This creates upward magnetic pull. The higher the reading, the stronger the observed pressure.
Negative Throttle (Red): Data shows dealers are being forced to sell. Put delta is gaining sensitivity. This creates downward magnetic pull. The higher the reading, the stronger the observed pressure.
Neutral Zone (Yellow): Forces appear balanced based on current positioning data.
Pullback Signals: When pressure spikes and then reverses, the data suggests exhaustion. Dealers may have finished their adjustment.
The Time Element
Here’s what makes Dealer Throttle different from static gamma exposure readings:
It incorporates time decay.
A gamma level at 9:30 AM doesn’t exert the same force as that same level at 3:30 PM. As expiration approaches, options become more sensitive. Small moves in the underlying create large changes in delta. Dealers must hedge more aggressively.
Dealer Throttle captures this acceleration in the data.
Early in the session, the throttle is light. As the day progresses, it intensifies. In the final hours of an expiration day, it can become extreme.
This is why 0DTE trading feels so different from swing trading. The throttle is fully engaged.
How I Read the Data
I’m not going to give you a “buy when green, sell when red” system. That’s not how real trading works. And I’m not here to tell you what to do.
What I will tell you is this:
Dealer Throttle provides context through data.
When I see strong positive throttle and price is above the gamma flip level, the data suggests the path of least resistance may be up.
When I see negative throttle building below the flip level, the data shows dealers are likely selling into any bounce.
When I see throttle spike and then reverse while price is extended, the data pattern often precedes a pullback.
It’s not about prediction. It’s about reading the data.
The Data You’ve Been Missing
Most retail traders have no idea this data exists. They’re playing checkers while the dealers play chess.
They see a “support level” and buy. They don’t see the data showing massive put open interest where dealers are programmed to sell into any bounce.
They see a “breakout” and chase. They don’t see the data showing a call wall where dealers will sell stock to hedge.
They wonder why the market seems designed to take their money.
It’s not a conspiracy. It’s mechanics. It’s data. And now you can see it.
Learn to Catch Your Own Fish
So here I am, offering you what no algorithm can give you — the ability to learn, earn, and catch the fish yourself.
Dealer Throttle is available exclusively to IKIGAI members as part of our proprietary indicator suite.
The indicator integrates with my daily Q Levels data, displaying real-time dealer pressure based on actual options positioning data—not lagging indicators or theoretical models.
Combined with our live trading sessions and algorithm instruction, you’ll finally understand what the data reveals about why price moves the way it does.
Stop trading blind. Start reading the data.

Qamar Zaman is the creator of the Q Levels system, host of Coffee With Q, and founder of the IKIGAI trading mentorship program. His proprietary indicators help traders visualize institutional positioning data.
Want to learn more?
Disclaimer
IKIGAI ALGO Disclaimer
This content is for education and market research only. I am not a licensed financial advisor, broker, or certified analyst. Nothing shown or discussed here constitutes financial advice, a trade signal, or a recommendation to buy or sell any security.
All trades and opinions shared are personal views intended solely for learning purposes. You are fully responsible for your own trading decisions and risk management. Trading involves significant risk — never trade with funds you cannot afford to lose.
By participating in IKIGAI or using any of our tools, you acknowledge and accept these terms.
— IKIGAI ALGO by Coffee With Q