
🎯 THE SETUP – WHAT WE SAID THIS Dec 31st MORNING
Published: December 31, 2025 | Author: Q Levels Trading | Coffee With Q
Our Educational Framework for Dec 31:
- Spot: 687.01
- Key Pivot: FLIP at 688
- Study Range: 687-690 (New Year’s Eve half-day)
- Critical Support: 685 (144M positioning)
- Warning: “Below flip = bearish bias”
The Teaching Point: We noted price was sitting BELOW the flip at 688, which suggested bearish territory. We emphasized 685 as critical support with massive put positioning.
Read this morning’s EDGE News here
📊 WHAT ACTUALLY HAPPENED
Market Delivered a Lesson:
- Price opened near 687
- Lost the 685 support level we highlighted
- Dropped to 681.84
- A 5+ point move lower from the open
- Markets closed at 1:00 PM EST (New Year’s Eve half-day)
The Educational Takeaway: When a critical support level (685) with 144M positioning and heavy puts breaks, price can accelerate. This is EXACTLY why we study these levels – not to predict, but to understand WHERE the market might react and HOW it might move.
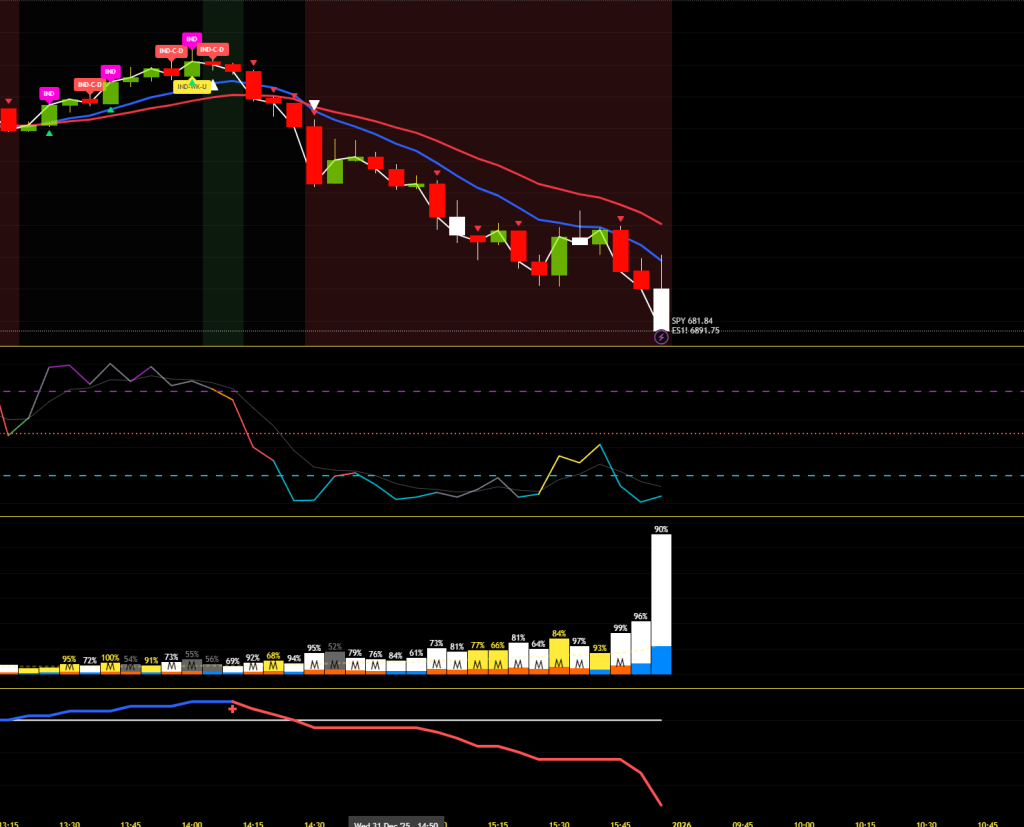
🔥 HOW IKIGAI MASTER QZ STRUCTURE PERFORMED – THE REAL STORY
Chart Analysis Shows Smart Money Structure:
Looking at the 5-minute chart, the IKIGAI Master QZ Structure indicator fired multiple signals throughout the session, showing exactly where institutional players were operating.
📊 Signal Types Explained:
- IND — Inducement detected (trap is set)
- IND-C-U / IND-C-D — Inducement collected (direction confirmed)
- IND-WK-U / IND-WK-D — Weak attempt (trying to break, can’t hold)
- VTC-Bulls / VTC-Bears — Valid trend change confirmed
🎯 What the Indicator Caught on Dec 31:
Throughout the session, we saw multiple IND signals (pink labels) showing where traps were being set – these are liquidity grabs where one side gets baited in before the real move happens.
As price dropped through our highlighted 685 support level toward 681.84, the structure showed IND-C-D signals (red labels) – confirming inducement was collected to the downside. This meant bears were in control after longs got trapped at higher levels.
The Teaching Moment: The indicator wasn’t “calling trades” – it was showing you:
- WHERE smart money was setting traps (IND signals)
- WHEN those traps got sprung (IND-C signals)
- HOW the structure was breaking down bearishly
That’s the framework for understanding institutional flow and structure.
📚 WHAT THIS TEACHES US
Lesson 1: Levels Show Structure, Not Destiny
We said 685 was critical support with 144M positioning. When it broke, price accelerated lower to 681.84. The level didn’t “fail” – it showed you WHERE the critical decision happened and what breaking it meant.
Lesson 2: Below Flip = Respect the Bias
We were below 688 flip (bearish territory) all session. The market respected that bias. This is what studying flip zones teaches you – it’s not a prediction, it’s a framework for understanding directional bias.
Lesson 3: IKIGAI Shows Institutional Structure
The IND and IND-C signals throughout the day weren’t “trade calls” – they were INFORMATION about:
- Where liquidity traps were being set
- When those traps got collected
- How institutional flow was moving
Lesson 4: Honor Your Stops
If you had a stop below 685 (which we identified as critical support with heavy positioning), you got out before the 5-point drop. This is risk management in action – not being “right,” but protecting capital.
🎆 CLOSING OUT 2025 – THE BIGGER PICTURE
This Week’s Educational Journey:
📌 Dec 29: We warned about smart money distribution with PATH SHIFT and V+ alerts – Price rejected from highs ✅
📌 Dec 30: Called massive put walls at 688-689 with 632M combined positioning – Price struggled at those exact levels ✅
📌 Dec 31: Called 685 as critical support (144M), warned below flip = bearish – Support broke, price dropped 5+ points to 681.84 ✅
The Pattern:
- Q Levels showed the structure and key pivot points
- IKIGAI Master QZ showed where smart money set traps and collected liquidity
- Together, they gave you a FRAMEWORK to understand what was happening
💭 FINAL THOUGHTS – NOT ABOUT BEING RIGHT
Here’s what matters:
✅ Did the levels show you where key structure was? YES – 685, 688 flip, 690 resistance all played exactly as positioned
✅ Did the flip zone indicate directional bias? YES – Below 688 = bearish, and we stayed bearish
✅ Did IKIGAI show you where traps were set and collected? YES – IND and IND-C signals marked the institutional activity
✅ Did you learn something about market behavior? THAT’S THE GOAL
We’re not here to be “right.” We’re here to TEACH YOU TO THINK.
When 685 broke with 144M positioning and heavy puts, did you:
- Recognize the support failure?
- Respect the bearish bias below flip?
- See the IND-C signals as confirmation of downside collection?
- Manage your risk accordingly?
That’s the education.
🚀 2026 STARTS FRIDAY
Fresh year. Fresh charts. Same framework:
- Q Levels for structure and key pivots
- IKIGAI Master QZ Structure for institutional flow and traps
- Your brain for decision-making and risk management
Markets are closed tomorrow (January 1st, 2026). We’ll be back with Q Levels and EDGE News when trading resumes January 2nd.
🎊 HAPPY NEW YEAR FROM Q LEVELS TRADING!
Thank you for being part of this educational journey in 2025. Every setup, every level, every signal, every lesson – they all build your trading framework and understanding.
2026 is a fresh start:
- New levels to study
- New structure to understand
- New traps to identify
- New lessons to learn
Study hard. Think critically. Trade responsibly.
See you in 2026! 🎆
⚖️ FULL DISCLOSURE
This is not investment advisory. I’m not calling trades. I’m teaching you to think.
Trading futures and options involves substantial risk of loss and is not suitable for all investors. Past performance is not indicative of future results. The IKIGAI Algo and any associated indicators, tools, or educational materials are provided for informational and educational purposes only and do not constitute financial, investment, or trading advice. You should consult with a qualified financial advisor before making any trading decisions. Q Levels and affiliated parties are not registered investment advisors, broker-dealers, or financial planners. By participating in this program, you acknowledge that you are solely responsible for your own trading decisions and any resulting gains or losses. No guarantees of profit or specific results are made or implied. All sales are final. Please trade responsibly and only risk capital you can afford to lose.
— Q Levels Trading | Coffee With Q
🎆 Study the levels, think for yourself! ☕📚
Happy New Year 2026! 🎆